The learning curve – an analysis of the development of Mr Alan Doherty’s laparoscopic prostatectomy service
Dr Richard Viney MBChB MRCS FRCS (urol)
The learning curve in a production setting is a concept which was first introduced in the aeronautical industry during the 1920s.
It was developed to analyse the time taken to move from the initial phase of production, where work is slower and less efficient, to a more effective phase, once production is well established.
Clearly, the notion of a learning curve is relevant in surgery. When developing a new service, or introducing a new technique, there will be a phase when the surgeon only has a small amount of experience in that procedure.
Understanding this learning curve is very important in order to minimise risks to patients, but at the same time, allow for the development of new services.
The learning curve enables us to divide the introduction of a new procedure into the early ‘ramping up’ stage and the later ‘production’ phase.
In the early ‘ramping up’ phase, measures such as mentoring and low risk case mix should be introduced to minimize adverse outcomes for patients. Once the surgeon completes their learning curve and are in the ‘production phase’ the risk to patients will be minimal.
However, the learning curve has not been applied as effectively to surgery as it potentially could be.
The learning curve is generally measured in terms of operating time. While this is a simple variable, which is valuable in terms of planning theatre time, it is of little significance for patients in terms of clinical outcomes. Equally, it is highly subjective and can be manipulated.
I set out to explore the use of additional variables in a study of the data of Mr Alan Doherty, of Birmingham Prostate Clinic and the Queen Elizabeth Hospital in Birmingham.
Mr Doherty is one of a small number of surgeons in the UK undertaking laparoscopic prostatectomies. I approached Mr Doherty because he has carried out a large number of these complex, specialised procedures and he has an extensive, audited database of all patients’ results.
My analysis was of the first 300 laparoscopic prostatectomies performed by Mr Doherty between June 2003 and June 2006.
I introduced two new variables in addition to operating time. A very precise measurement of post-operative PSA was used, along with positive margins.
Positive margins is the term used to describe any evidence of malignant cells at the edge of the removed prostate. This would present a risk of some tumour cells remaining in the surgical field.
Both of these variables are clinically relevant and cannot be adjusted or manipulated.
I used what is known as Statistical Process Control charts (SPC) to assess these variables. SPC charts are not league tables – they do not rank one surgeon against another.
Instead, they set out the limits of expected standards, allowing for risk adjustment and single case variation.
The analysis demonstrated that in terms of operating times, Mr Doherty moved from the ramping up stage to production stage after the 28th patient.
The transition was at the 30th patient in terms of uPSA (Ultra-sensitive PSA) and 32nd for positive margins.
The analysis also shows that the learning curve is not a simple two phase process, but that learning continues throughout practice.
There is not one learning curve, but several, depending on which variable is being measured.
Mr Doherty’s data shows he was within acceptable standards during his learning curve of the first 30 cases. During the subsequent 270 cases, Mr Doherty exceeded acceptable standards.
To place this study into a wider text, it demonstrates how SPC charts can be used to chart a variety of measurements of the learning curve.
It offers a more rigorous model for governance, with the potential for issuing an early warning if standards fall below acceptable limits, and provides a far more meaningful assessment of clinical outcomes to inform both the patient and the surgeon. In this regard, they are useful for monitoring both the learning curve and the ongoing performance of the surgeon.
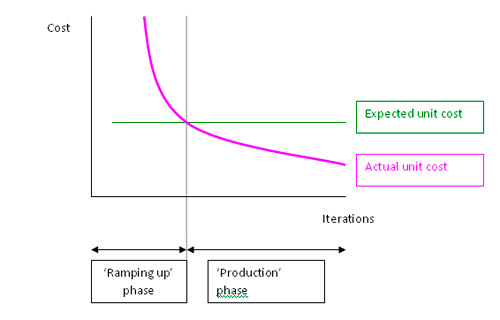
Chart showing the transition from 'ramping up' to 'production'
Categories
- Articles (23)
- Consultants' blog (40)
- Events (2)
- News (39)
- Patient Information (17)
- Patient viewpoints (21)
- Webcasts (3)
Tags
- Ahmed El-Modir (6)
- Alan Doherty (39)
- Aquablation (1)
- Benign Prostatic Hyperplasia (12)
- Biopsy (3)
- Bladder (3)
- Bladder Pain (1)
- Brachytherapy (4)
- Cyberknife (6)
- Dan Ford (2)
- Diet (1)
- Greenlight Laser (11)
- HIFU (4)
- Ian McCafferty (1)
- Incontinence (8)
- kidney stones (1)
- Laparoscopic Prostatectomy (7)
- Male Sling (1)
- Maya Harris (3)
- Mesh Slings (2)
- Mohammed Belal (5)
- MRI before Biopsy (2)
- oligometastatic prostate cancer (1)
- PCA (9)
- Peyronie’s (1)
- Prostate (41)
- Prostate Cancer (46)
- Prostate Cancer Symptoms (4)
- Prostate Keyhole Surgery (5)
- Prostatectomy (19)
- Prostatitis (5)
- PSA (14)
- Radical Prostatectomy (7)
- Rezum (1)
- SABR (1)
- TURP (10)
- tvt (1)
- TVT Sling (2)
- TVT Slings (2)
- Urolift (5)
- vaginal mesh (1)
- vaginal mesh implant (1)
- Vaginal Slings (1)
- Vasectomy (2)
- Vasectomy Pain (1)
Archives
- November 2023 (1)
- June 2023 (1)
- July 2022 (1)
- August 2020 (1)
- July 2020 (1)
- June 2020 (1)
- March 2020 (2)
- October 2019 (2)
- September 2019 (1)
- July 2019 (3)
- May 2019 (1)
- March 2019 (1)
- January 2019 (2)
- December 2018 (2)
- August 2018 (1)
- June 2018 (1)
- April 2018 (1)
- March 2018 (1)
- January 2018 (1)
- November 2017 (1)
- October 2017 (1)
- July 2017 (1)
- June 2017 (1)
- May 2017 (2)